Against this challenging backdrop, REAP’s Alaska Network for Energy Education and Employment (ANEEE) spent the last year researching the clean energy-specific implications of this statewide trend. The resulting report, Powering Alaska’s Future: Opportunity Analysis of Clean Energy Workforce Challenges and Potential Solutions, draws on 43 informational interviews and 10 Alaska Energy Training Group meetings with training providers, utilities, businesses, workers, Tribal entities, state employees, local governments, nonprofits, and community groups, in addition to employment data from the U.S. Energy & Employment Report (USEER), a broad literature review, and REAP’s 2019 Gap Analysis of Alaska’s Clean Energy Education & Training Opportunities by Chris McConnell. The Opportunity Analysis was made possible with funding from the Office of Naval Research.
This blog post is the first in a four-part series highlighting key findings from the report. This installment lays the foundation by defining and putting numbers to Alaska’s clean energy workforce and in-demand careers. Subsequent posts will focus on clean energy workforce challenges, potential solutions, and future priorities, which are all laid out in more detail in the full report.
Defining Alaska’s Clean Energy Workforce
While hands-on renewable energy positions, such as wind turbine technicians and solar installers, are often the most visible clean energy jobs, clean energy careers are a larger share of the workforce than just positions in renewable generation technologies. This report defines the clean energy workforce as positions that support efforts to minimize energy waste (i.e., energy efficiency) and to generate, store, transmit, distribute, and use energy from renewable resources. Energy efficiency and renewable energy workers are employed within many different industries and sectors, including construction, manufacturing, utilities, transportation, government, and nonprofit organizations. Using a broad definition of the clean energy workforce recognizes the connections between different roles, skills, and industries, and their importance in advancing energy efficiency and renewable energy projects.
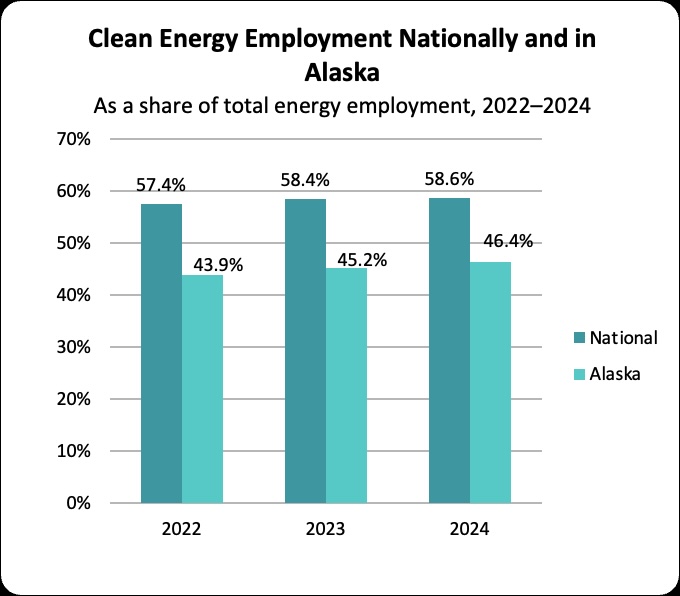
Applying this definition to 2022–2024 employment data from the 2023–2025 USEERs shows that 46.4% (12,882 jobs) of all direct energy positions in Alaska in 2024 were clean energy roles. This lags significantly behind the national percentage of clean energy jobs in the energy sector, as seen in Figure 1. Alaska’s clean energy share also trails cold-climate and remote or isolated peer states, but is comparable to other fossil-fuel-dependent states. Alaska’s 11.6% clean energy job growth over that time period, however, vastly outpaces most peer states’ clean energy job growth and national clean energy job growth. With approximately 1,330 new jobs in two years, Alaska’s clean energy workforce is growing faster than similar economies, despite starting from a lower base. Maine is the only peer state with a higher growth rate from 2022 to 2024, suggesting that further study and outreach to understand their workforce strategies could be beneficial. More information about the peer state comparison is included in the report’s Introduction (p. 10) and Appendix C (p. 53).
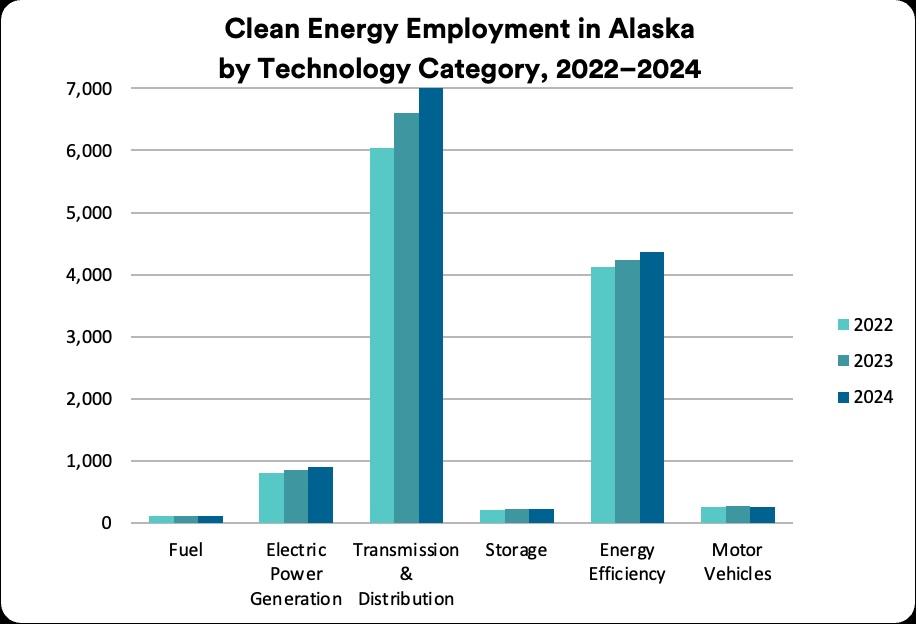
As seen in Figure 2, the largest and fastest-growing clean energy job category in Alaska during this time period was transmission & distribution (T&D), with broad growth in smart grid, microgrid, traditional T&D, and other grid modernization roles. All T&D subcategory jobs were considered clean in this analysis, due to grid infrastructure’s crucial role in renewable energy deployment. It is important to note, however, that T&D positions also support fossil fuel distribution. For more information about the specific job subcategories considered clean in this analysis, check out the Introduction (p. 9) and Appendix C (p. 53). The second largest clean energy job category was energy efficiency, which experienced marked growth in efficient appliance and lighting installation and traditional heating, ventilation, and cooling (HVAC) jobs. Electric power generation positions are the third largest clean energy job category, followed by motor vehicles, storage, and fuel positions, respectively.
Figure 1: Clean Energy Employment Nationally and in Alaska, 2022–2024. Sources: 2023, 2024, and 2025 USEERs
Figure 2: Clean Energy Employment in Alaska by Technology Category, 2022-2024. Sources: 2023, 2024, and 2025 USEERs.
Targeting In-Demand Clean Energy Positions
Identifying the clean energy jobs with the highest demand and lowest supply is key to focusing efforts within Alaska’s tight labor market and is the subject of the first chapter of the Opportunity Analysis (p. 17). In informational interviews for this report, 60% of participants reported that hiring or retaining staff was difficult. Other employer surveys echo this sentiment: Nearly half (48.2%) of Alaska energy employers surveyed for the 2025 USEER survey reported hiring difficulty, while most others (47.1%) did not hire at all. Only 4.6% said hiring was “not at all difficult.”
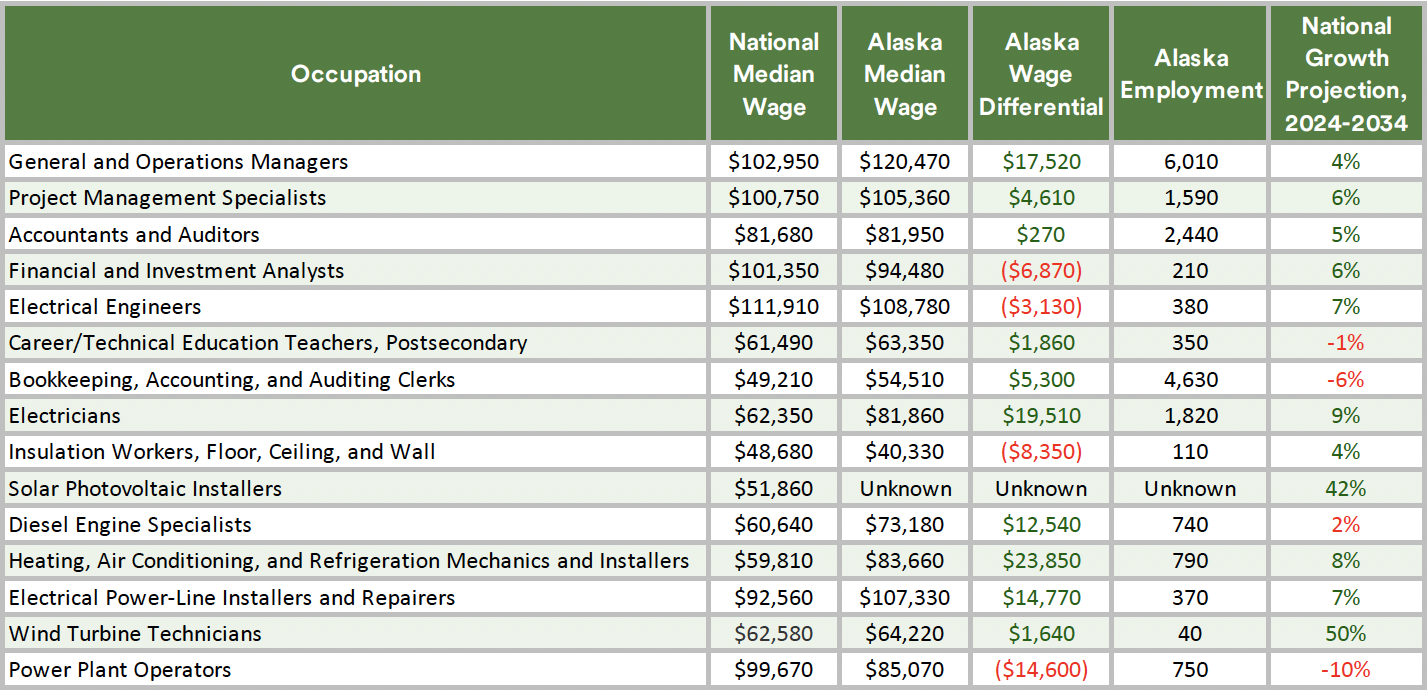
When asked which positions were most difficult to fill and retain, interviewees identified 15 roles experiencing labor shortages, steep competition, or both. Pay, competition, and workforce size all contribute to these challenges. Table 1 shows the in-demand jobs identified in interviews, alongside wage data, employment numbers, and job growth projections from the U.S. Bureau of Labor Statistics.
Table 1: In-Demand Clean Energy Roles. Interviewees identified these occupations as either difficult to recruit for or retain. Wage, workforce size, and growth projection information is included for each in-demand role. Sources: Informational Interviews; BLS Occupational Employment and Wage Statistics, May 2024; and BLS Occupational Outlook Handbook.
Note: The average projected growth rate across all occupations from 2024-2034 is 3%.
Interviewees identified a broad mix of construction trades and project planning and management occupations, with varying salary ranges, required work experience and education, and employment impacts. Jobs with high national growth projections, with wages near or below the national median, and that serve rural remote or hub communities are likely to be the most challenging to staff, and where the most urgent and innovative solutions are needed.
Sharing the Insights
The full Opportunity Analysis is available to download for free by completing the form at the top of this post and following the resulting download link. REAP is excited to share actionable takeaways from this report and work with partners across the state to promote and adopt solutions that accelerate the development of Alaska’s clean energy workforce. With that in mind, REAP hosted a 2026 Spring Energy Speaker Series webinar that covered key findings from the Opportunity Analysis with a presentation from REAP’s ANEEE Program Manager, Jenny Starrs, as well as a panel discussion with statewide workforce development practitioners. Please feel free to watch and share the recording of that discussion with others you know who are interested in this important topic. And stay tuned for next week’s entry in this four-part series, which will focus on fleshing out five workforce challenges blocking clean energy progress across the state.